
MACD Trading Technique (Professional Overview)
The Moving Average Convergence Divergence (MACD) indicator is a powerful tool for identifying market trends, momentum, and potential reversals. Below is a professional breakdown of how to trade effectively using the MACD:
Components of MACD
- MACD Line: Difference between the 12-period EMA and 26-period EMA.
- Signal Line: 9-period EMA of the MACD line.
- Histogram: Visual representation of the difference between the MACD line and the signal line.
How to Use MACD in Trading
1. Trend Identification
- Bullish Trend: The MACD line is above the signal line and both are above the zero line.
- Bearish Trend: The MACD line is below the signal line and both are below the zero line.
2. Crossover Strategy
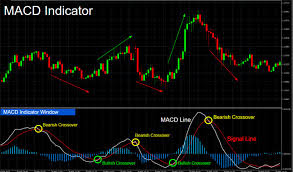
- Bullish Crossover: When the MACD line crosses above the signal line. This indicates a potential buying opportunity.
- Bearish Crossover: When the MACD line crosses below the signal line. This signals a potential selling opportunity.
3. Divergence Analysis
- Bullish Divergence: Price makes lower lows, but the MACD makes higher lows. Indicates a potential reversal to the upside.
- Bearish Divergence: Price makes higher highs, but the MACD makes lower highs. Suggests a possible reversal to the downside.
4. Zero Line Cross
- When the MACD line crosses the zero line:
- Upwards: Confirming bullish momentum.
- Downwards: Confirming bearish momentum.
5. Histogram Analysis
- Histogram bars increasing in size indicate strengthening momentum.
- Histogram bars shrinking suggest weakening momentum.
Professional Application
Timeframes:
- Use higher timeframes (H1, H4, Daily) for trend confirmation.
- Apply lower timeframes (M5, M15) for precise entries.
Combine with Support and Resistance:
- Enter trades only near significant support or resistance levels for higher accuracy.
Risk Management:
- Always use a stop-loss (SL) to protect against adverse moves.
- Target a risk-reward ratio of at least 1:2.
Filter Noise:
- Avoid trading during high-impact news events.
- Ensure the MACD histogram and crossover signals align with overall market trends.
Example Trade Setup
- Timeframe: H1
- Pair: EUR/USD
- Bullish Signal:
- MACD line crosses above the signal line below the zero line (reversal signal).
- Enter a buy trade.
- Set SL below the recent swing low.
- Set TP at the nearest resistance or a 1:2 risk-reward level.
Mastering MACD requires practice and experience. Combine it with other technical tools like RSI or candlestick patterns for robust strategies.
Register Now!!
